01:00
MATH 427: The Big Picture
Eric Friedlander
Having a successful semester in MAT 427
Five tips for success
Complete all the preparation work (readings and videos) before class.
Ask questions, come to office hours and help session.
Do the homework; get started on homework early when possible.
Don’t procrastinate and don’t let a week pass by with lingering questions.
Stay up-to-date on announcements on Canvas and sent via email.
Emails for help
If you email me about an error please include a screenshot of the error and the code causing the error.
Questions?
Raise your hand or email me.
Machine Learning
What is Machine Learning?
- Machine Learning is the study of tools/techniques for extracting information and making predictions from complex datasets
- The name machine learning was coined in 1959 by Arthur Samuel
- “Field of study that gives computers the ability to learn without being explicitly programmed”
What is Machine Learning?
Tom M. Mitchell (1998):
A computer program is said to learn from experience E with respect to some class of tasks T and performance measure P if its performance at tasks in T, as measured by P, improves with experience E.
What is Machine Learning?
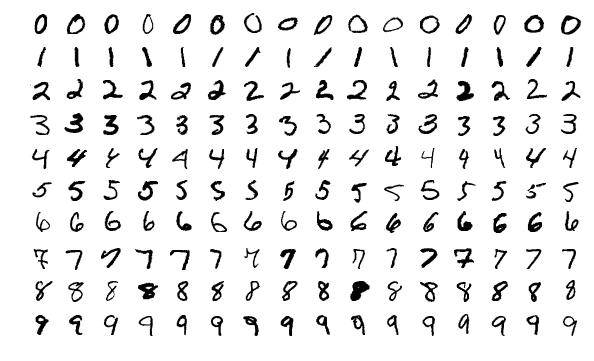
MNIST handwritten digits (from ISLR, James et al.)
Question!!!
Suppose your email program watches which emails you do or do not mark as spam, and based on that learns how to better filter spam. According to Tom Mitchell’s definition, which of the following is the task T, experience E, and performance measure P in this setting?
- P The number (or fraction) of emails correctly classified as spam/ham (not spam)
- T Classifying emails as spam or ham
- E Watching you label emails as spam or ham
Statistical Learning vs Machine Learning vs Data Science
- Machine learning arose as a sub-field of Artificial Intelligence which is a sub-fields of Computer Science
- Statistical learning arose as a sub-field of Statistics
- There is much overlap, a great deal of “cross-fertilization”
- “Data Science” - Reflects the fact that both statistical and machine learning are about data
- “Machine Learning” or “Data Science” are “fancier” terms
Statistics vs Machine Learning
- Statistics: more concerned with answering why and how things work, making inferences
- Machine/Statistical learning: more concerned with making predictions
Terminology/Notation
Ames Housing dataset - Contains data on 881 houses in Ames, IA. We are interested in predicting sale price.
The first ten observations are shown below.
| Sale_Price | Gr_Liv_Area | Garage_Type | Garage_Cars | Garage_Area | Street | Utilities | Pool_Area | Neighborhood |
|---|---|---|---|---|---|---|---|---|
| 244000 | 2110 | Attchd | 2 | 522 | Pave | AllPub | 0 | North_Ames |
| 213500 | 1338 | Attchd | 2 | 582 | Pave | AllPub | 0 | Stone_Brook |
| 185000 | 1187 | Attchd | 2 | 420 | Pave | AllPub | 0 | Gilbert |
| 394432 | 1856 | Attchd | 3 | 834 | Pave | AllPub | 0 | Stone_Brook |
| 190000 | 1844 | Attchd | 2 | 546 | Pave | AllPub | 0 | Northwest_Ames |
| 149000 | NA | Attchd | 2 | 480 | Pave | AllPub | 0 | North_Ames |
| 149900 | NA | Attchd | 2 | 500 | Pave | AllPub | 0 | North_Ames |
| 127500 | 1069 | Attchd | 2 | 440 | Pave | AllPub | 0 | Northpark_Villa |
| 395192 | 1940 | Attchd | 3 | 606 | Pave | AllPub | 0 | Northridge_Heights |
| 290941 | 1544 | Attchd | 3 | 868 | Pave | AllPub | 0 | Northridge_Heights |
Terminology/Notation
Default dataset - Contains credit card default data on 10,000 individuals. We are interested in predicting whether somebody will default or not.
Ten observations are shown below.
| default | student | balance | income |
|---|---|---|---|
| No | No | 939.0985 | 45519.02 |
| No | Yes | 397.5425 | 22710.87 |
| Yes | No | 1511.6110 | 53506.94 |
| No | No | 301.3194 | 51539.95 |
| No | No | 878.4461 | 29561.78 |
| Yes | No | 1673.4863 | 49310.33 |
| No | No | 310.1302 | 37697.22 |
| No | No | 1272.0539 | 44895.59 |
| No | No | 887.2014 | 41641.45 |
| No | No | 230.8689 | 32798.78 |
Terminology/Notation
- Response/Target/Outcome - variable we are interested in predicting, denoted as \(Y\)
- Features/Inputs/Predictors - variables used to predict the response, denoted as \(X\)
- Feature Matrix - all features taken together, denoted as \(\mathbf{X}\)
- Number of data points/observations denoted as \(n\)
- Number of features/inputs/predictors denotes as \(p\)
- Missing entries in R are denoted as
NA
Question!!!
For the Ames Housing and Default datasets:
- What are the corresponding values of \(n\) and \(p\)?
- What will be the dimension of the corresponding response vector \(Y\)?
- What is the value of the 3rd feature for the 2nd observation?
- What are the corresponding values of \(n\) and \(p\)?
- Ames: \(n = 881\) and \(p = 9\)
- Default: \(n = 10000\) and \(p = 4\)
- What will be the dimension of the corresponding response vector \(Y\)?
- Ames: \(881\times 1\)
- Default: \(10000\times 1\)
- What is the value of the 3rd feature for the 2nd observation?
- Ames:
Attchd - Default:
397.5425
- Ames:
Question!!!
Suppose you have information about 867 cancer patients on their age, tumor size, clump thickness of the tumor, uniformity of cell size, and whether the tumor is malignant or benign. Based on these data, you are interested in building a model to predict the type of tumor (malignant or benign) for future cancer patients.
- What are the values of \(n\) and \(p\) in this dataset? \(n = 867, p = 5\)
- What are the inputs/features?
Supervised vs Unsupervised Learning
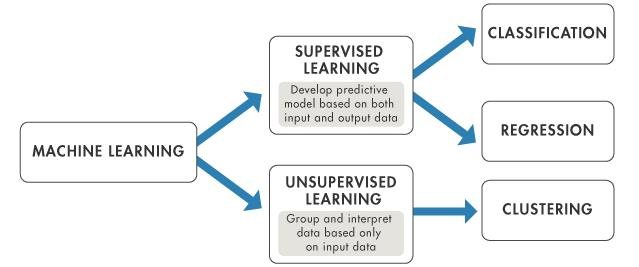
Machine Learning Tasks (from Bunker and Fayez, 2017)
Supervised Learning
- We have access to labeled data
- Objective: learn overall pattern of relationship between the inputs (\(\mathbf{X}\)) and response (\(Y\)) in order to
- Investigate the relationship between inputs and response
- Predict for potential unseen test cases
- Assess the quality of predictions
Types of Supervised Learning
Supervised Learning problems can be categorized into:
- Regression problems (response is quantitative, continuous)
- Classification problems (response is qualitative, categorical)
- What if I have discrete quantitative data (e.g. counts)?
- Can use either but one is probably better…
- How many discrete values are there?
- Enough we can think of the response as continuous?
- What is our goal?
- How important is being exactly correct?
Unsupervised Learning
- No response/outcome variable, just \(\mathbf{X}\)
- Understand structure within data
- find similar groups of observations based on features (clustering)
- find a smaller subset of features with the most variation (dimensionality reduction)
- No gold-standard
- Easier to collect unlabeled data
- Useful pre-processing step for supervised learning
Unsupervised Learning
US Arrests dataset - Data on arrests for 50 US states.
The first ten observations are shown below.
| Murder | Assault | UrbanPop | Rape | |
|---|---|---|---|---|
| Alabama | 13.2 | 236 | 58 | 21.2 |
| Alaska | 10.0 | 263 | 48 | 44.5 |
| Arizona | 8.1 | 294 | 80 | 31.0 |
| Arkansas | 8.8 | 190 | 50 | 19.5 |
| California | 9.0 | 276 | 91 | 40.6 |
| Colorado | 7.9 | 204 | 78 | 38.7 |
| Connecticut | 3.3 | 110 | 77 | 11.1 |
| Delaware | 5.9 | 238 | 72 | 15.8 |
| Florida | 15.4 | 335 | 80 | 31.9 |
| Georgia | 17.4 | 211 | 60 | 25.8 |
Question!!!
For each of the following, identify whether the problem belongs to the supervised or unsupervised learning paradigm
- Examine the statistics of two football teams, and predict which team will win tomorrow’s match (given historical data of teams’ wins/losses to learn from) supervised
- Given genetic (DNA) data from a person, predict the probability of the person developing diabetes over the next 10 years supervised
- Take a collection of 1000 essays written on the US economy, and find a way to automatically group these essays into a small number of groups of essays that are somehow “similar” or “related” unsupervised
- Examine data on the income and years of education of adults in a neighborhood and build a model to predict the income from years of education supervised
Recap
- What is a Machine Learning algorithm?
- T: has task
- P: performance is measured
- E: improves with experience
- Terminology:
- Features
- \(p\)
- Target
- Observations
- \(n\)
- Features
- Supervised vs. unsupervised learning
- Supervised: data is labeled
- Unsupervised: data is unlabeled