MATH 427: Decision Trees Continued
Eric Friedlander
Computational Set-Up
Building a Tree and Prediction

From ISLR
Building a Tree
- Anyone know what a greedy algorithm is?
- Computationally infeasible to consider every possible partition
- Idea: top-down, greedy approach known as recursive binary splitting.
- top-down because it begins at the top of the tree
- greedy because at each step of the tree-building process, the best split is made at that particular step, rather than looking ahead and picking a split that will lead to a better tree in some future step
- Important for determining whether to use a ordinal encoding or not
- Stop when each terminal node has fewer than some predetermined number of observations
Overfitting
- This process described above is likely to overfit the data
- One solution: require each split to improve performance by some amount
- Bad Idea: sometimes seemingly meaningless cuts early on enable really good cuts later on
- Good solution: pruning
- Build big tree and the prune off branches that are unnecessary
Tree Pruning
From Hands-On Machine Learning, Boehmke & Greenwell
Bias-Variance Trade-Off
- How does the bias-variance trade-off relate to the bias-variance trade-off?
- Would larger trees have high or lower bias?
- What about variance?
Tree Pruning
- Grow a very large tree, and then prune it back to obtain a subtree.
- Terminology: cost complexity pruning or weakest link pruning
- Consider the following objective function \[ \begin{aligned} &SSE(T) + \alpha \times |T|\\ &\quad= SSE(T) + \alpha \times (\text{# of terminal nodes of }T) \end{aligned} \]
Cost-Complexity Pruning
- Fit full tree \(T_0\) to minimise \(SSE\)
- Select sub-tree \(T\subset T_0\) which minimizes \[ \begin{aligned} &SSE(T) + \alpha \times |T|\\ &\quad= SSE(T) + \alpha \times (\text{# of terminal nodes of }T) \end{aligned} \]
- What should happen to the tree as we increase \(\alpha\)?
- What should happen to the bias and variance as we increase \(\alpha\)?
- How should we choose \(\alpha\)? Cross Validation
Regression Trees in R
Data: dcbikeshare
Bike sharing systems are new generation of traditional bike rentals where whole process from membership, rental and return back has become automatic. Through these systems, user is able to easily rent a bike from a particular position and return back at another position. As of May 2018, there are about over 1600 bike-sharing programs around the world, providing more than 18 million bicycles for public use. Today, there exists great interest in these systems due to their important role in traffic, environmental and health issues. Documentation
Rows: 731
Columns: 16
$ instant    <dbl> 1, 2, 3, 4, 5, 6, 7, 8, 9, 10, 11, 12, 13, 14, 15, 16, 17, …
$ dteday     <date> 2011-01-01, 2011-01-02, 2011-01-03, 2011-01-04, 2011-01-05…
$ season     <dbl> 1, 1, 1, 1, 1, 1, 1, 1, 1, 1, 1, 1, 1, 1, 1, 1, 1, 1, 1, 1,…
$ yr         <dbl> 0, 0, 0, 0, 0, 0, 0, 0, 0, 0, 0, 0, 0, 0, 0, 0, 0, 0, 0, 0,…
$ mnth       <dbl> 1, 1, 1, 1, 1, 1, 1, 1, 1, 1, 1, 1, 1, 1, 1, 1, 1, 1, 1, 1,…
$ holiday    <dbl> 0, 0, 0, 0, 0, 0, 0, 0, 0, 0, 0, 0, 0, 0, 0, 0, 1, 0, 0, 0,…
$ weekday    <dbl> 6, 0, 1, 2, 3, 4, 5, 6, 0, 1, 2, 3, 4, 5, 6, 0, 1, 2, 3, 4,…
$ workingday <dbl> 0, 0, 1, 1, 1, 1, 1, 0, 0, 1, 1, 1, 1, 1, 0, 0, 0, 1, 1, 1,…
$ weathersit <dbl> 2, 2, 1, 1, 1, 1, 2, 2, 1, 1, 2, 1, 1, 1, 2, 1, 2, 2, 2, 2,…
$ temp       <dbl> 0.3441670, 0.3634780, 0.1963640, 0.2000000, 0.2269570, 0.20…
$ atemp      <dbl> 0.3636250, 0.3537390, 0.1894050, 0.2121220, 0.2292700, 0.23…
$ hum        <dbl> 0.805833, 0.696087, 0.437273, 0.590435, 0.436957, 0.518261,…
$ windspeed  <dbl> 0.1604460, 0.2485390, 0.2483090, 0.1602960, 0.1869000, 0.08…
$ casual     <dbl> 331, 131, 120, 108, 82, 88, 148, 68, 54, 41, 43, 25, 38, 54…
$ registered <dbl> 654, 670, 1229, 1454, 1518, 1518, 1362, 891, 768, 1280, 122…
$ cnt        <dbl> 985, 801, 1349, 1562, 1600, 1606, 1510, 959, 822, 1321, 126…
Cleaning the Data
dcbikeshare_clean <- dcbikeshare |>
  select(-instant, -dteday, -casual, -registered, -yr) |>
  mutate(
    season = as_factor(case_when(
      season == 1 ~ "winter",
      season == 2 ~ "spring",
      season == 3 ~ "summer",
      season == 4 ~ "fall"
    )),
    mnth = as_factor(mnth),
    weekday = as_factor(weekday),
    weathersit = as_factor(weathersit)
  )
Split the Data
Recipe
Define Model Workflow
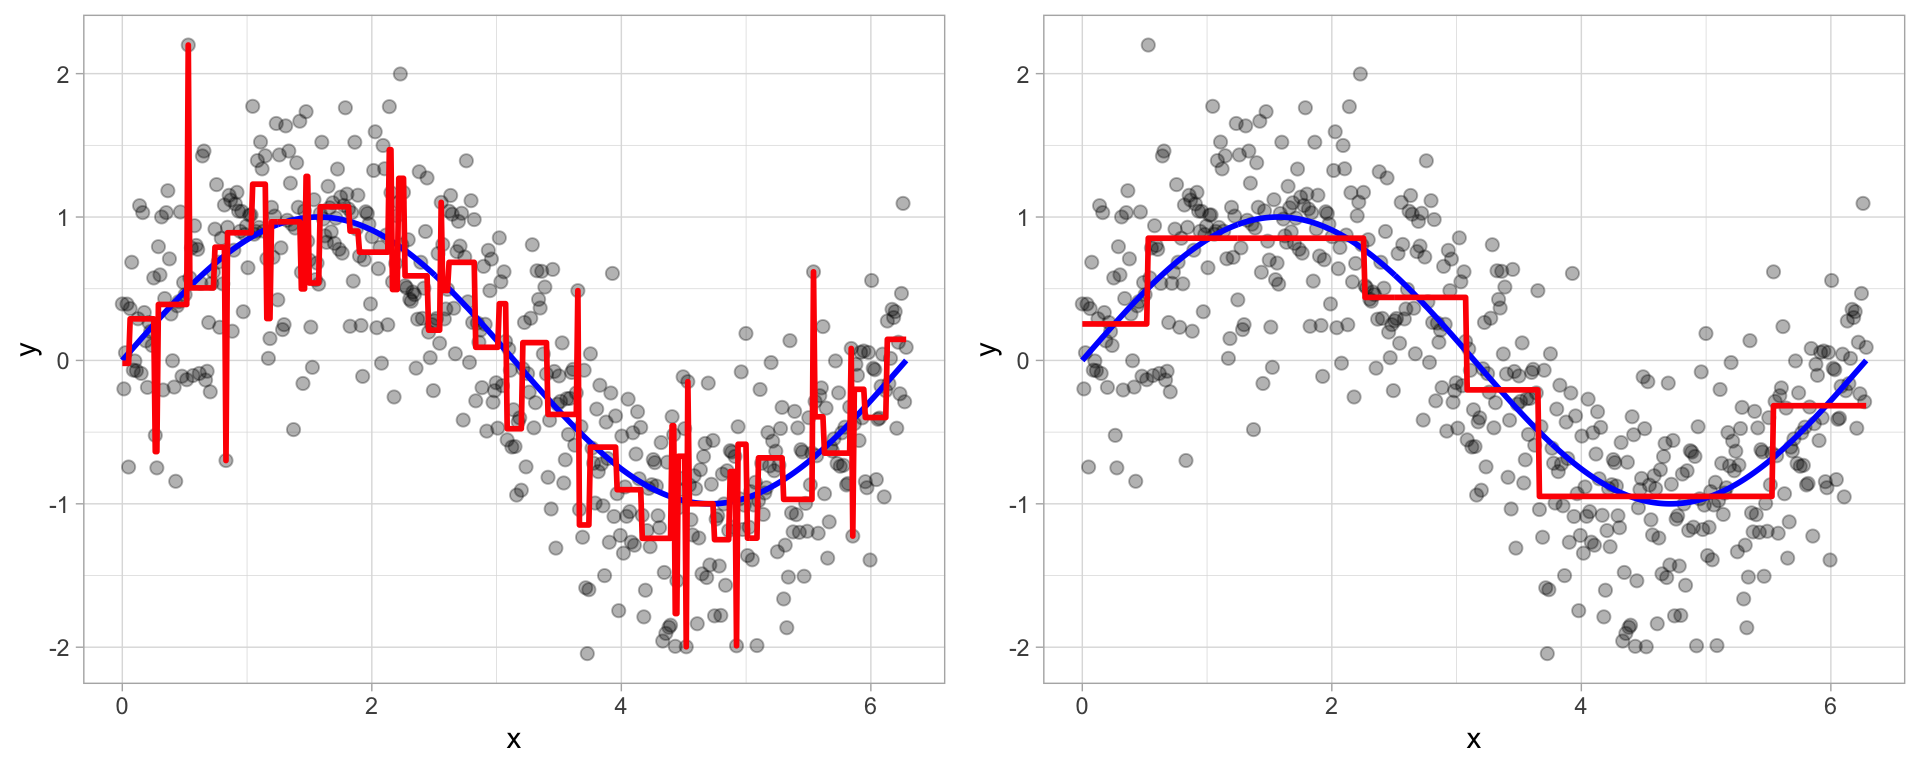
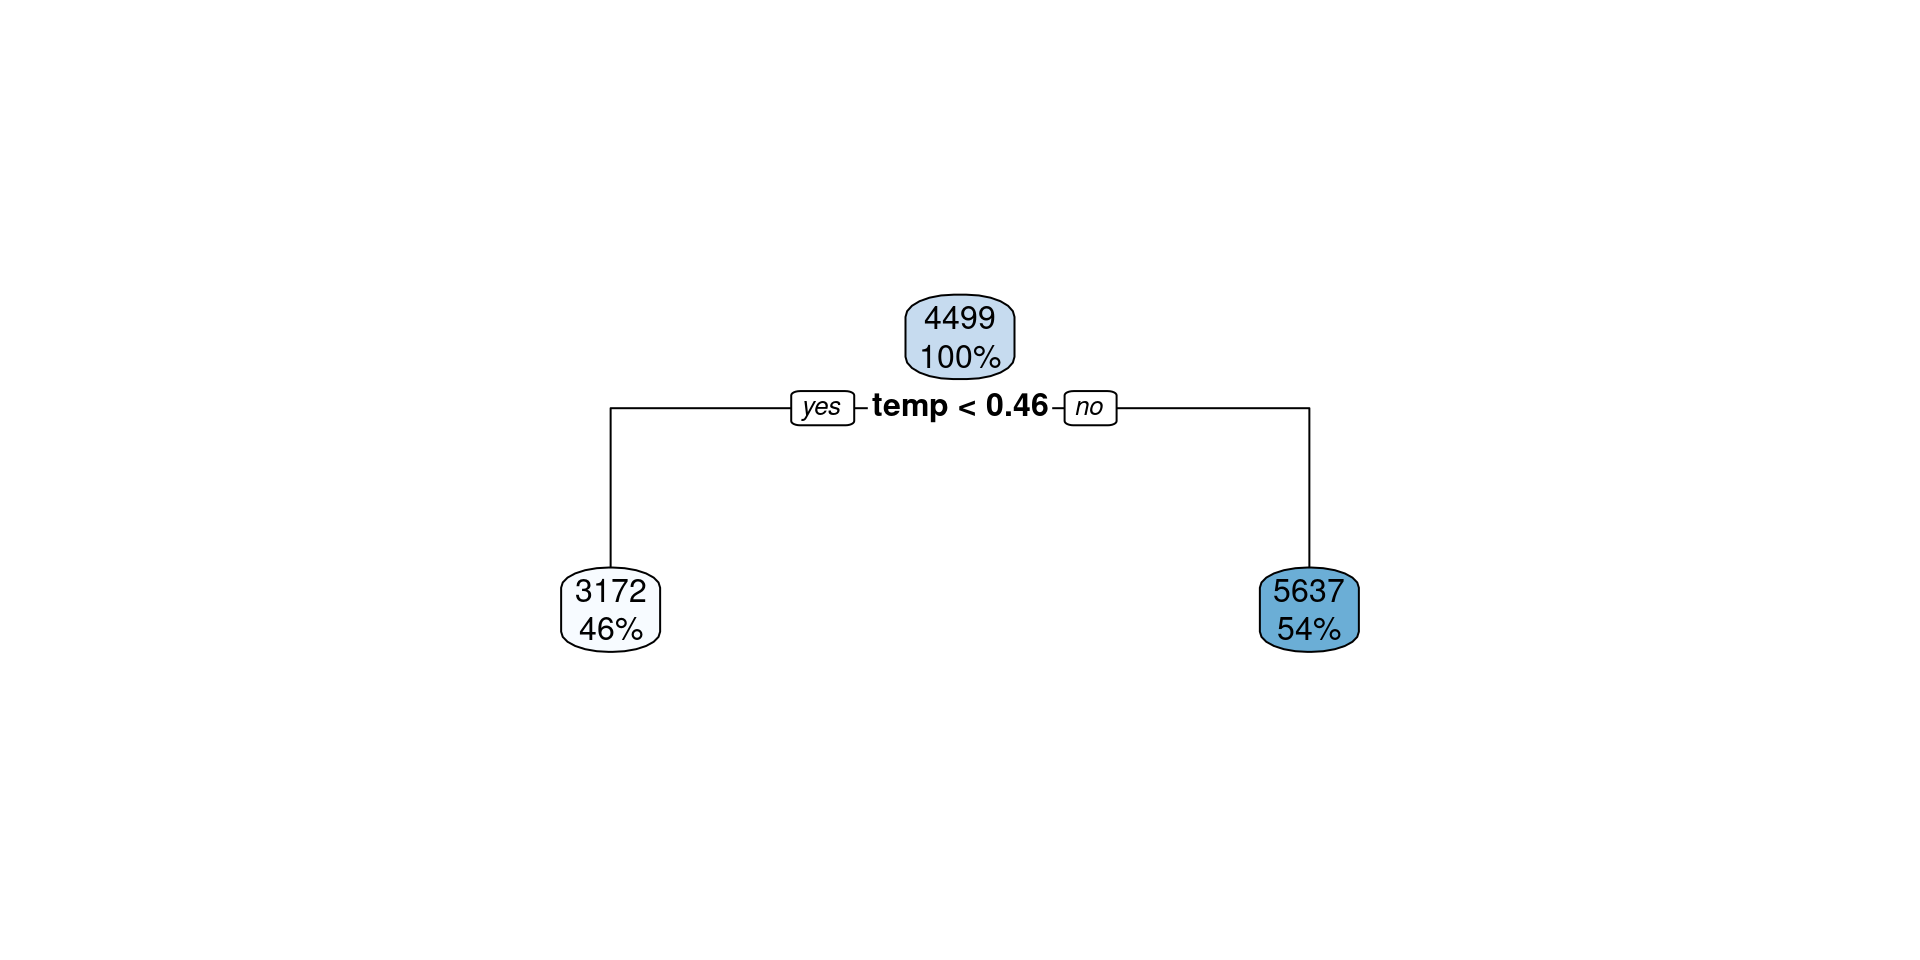
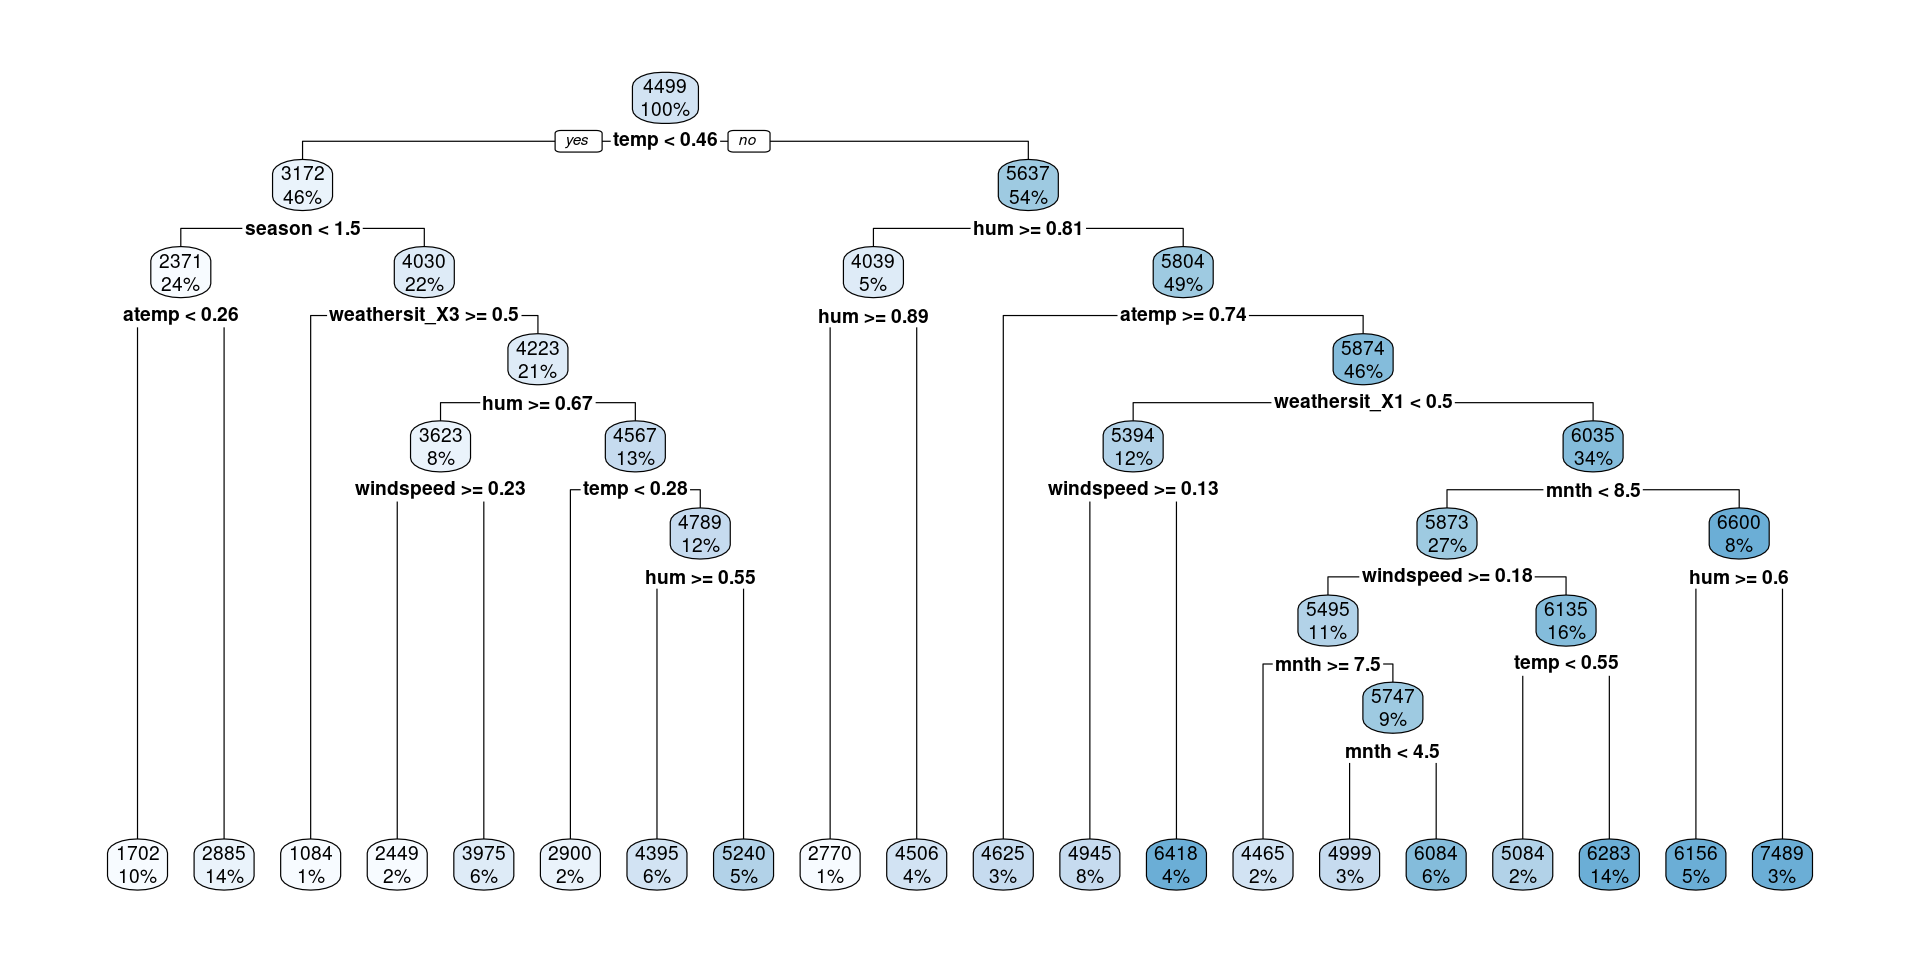
Visualize
Visualize
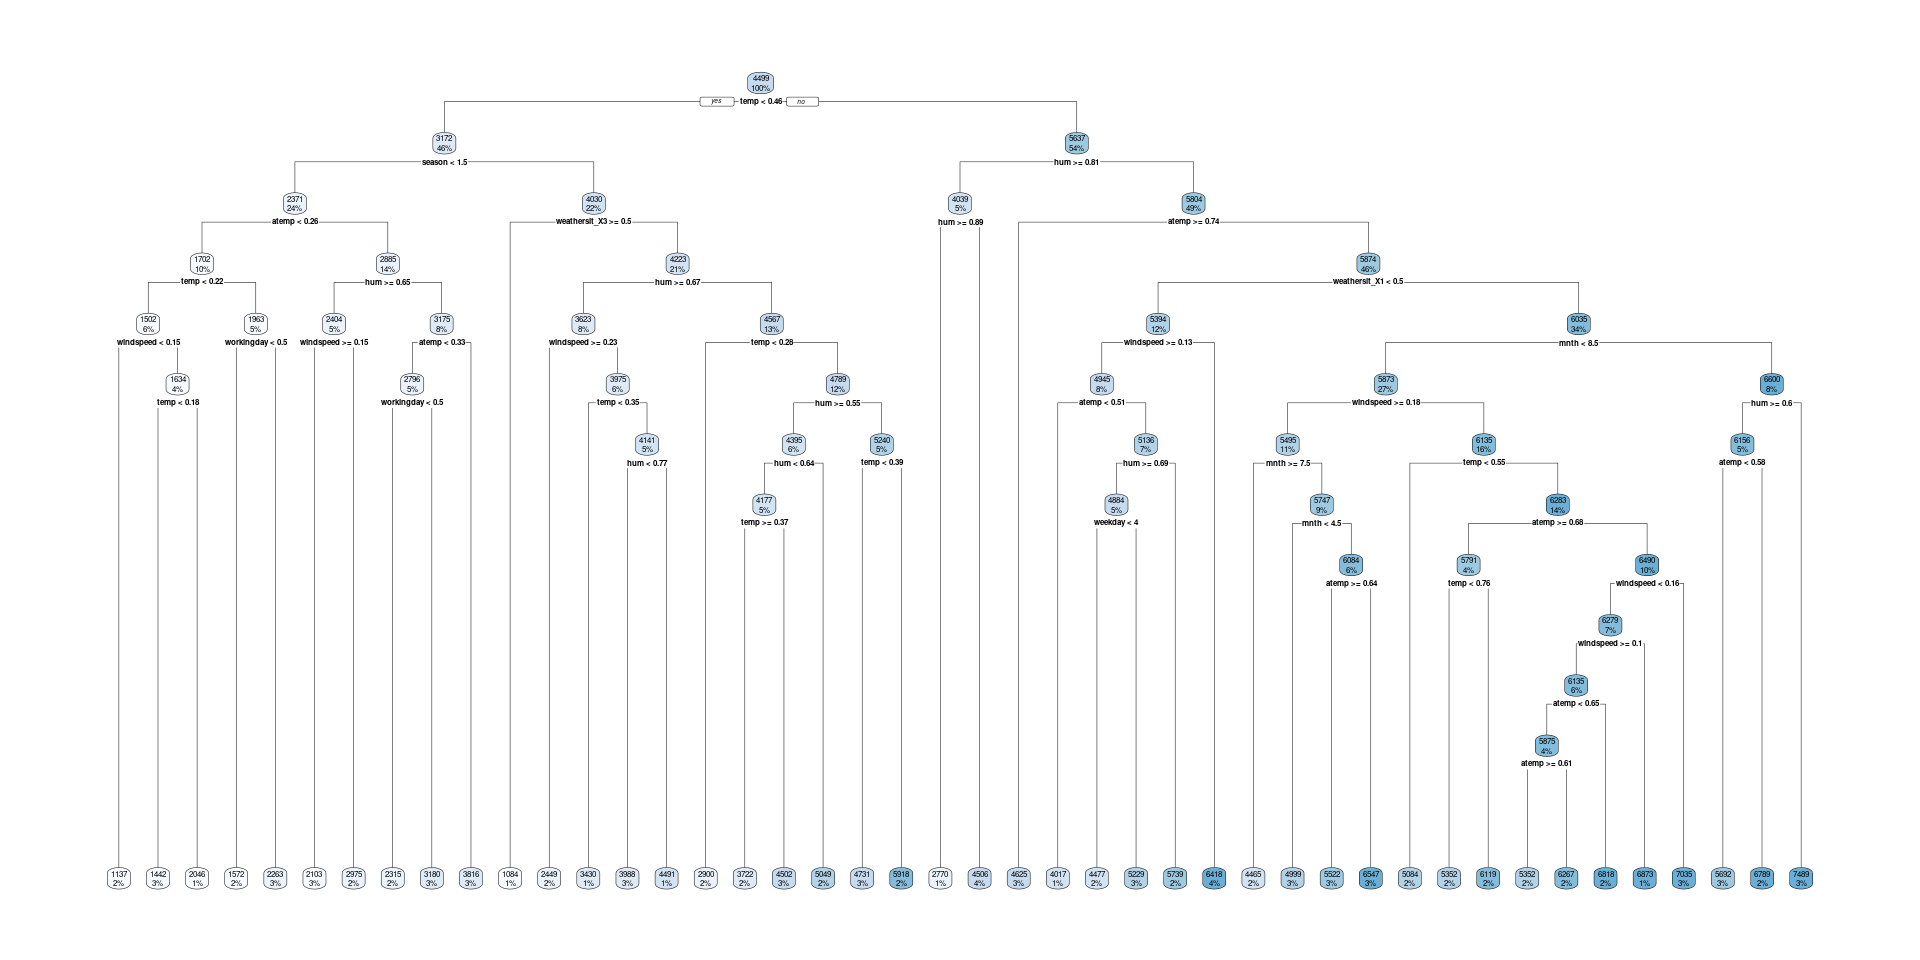
Visualize
Visualize
Defin Model Workflow with Tuning
Define Folds and Tuning Grid
Tuning CP
Plot Results
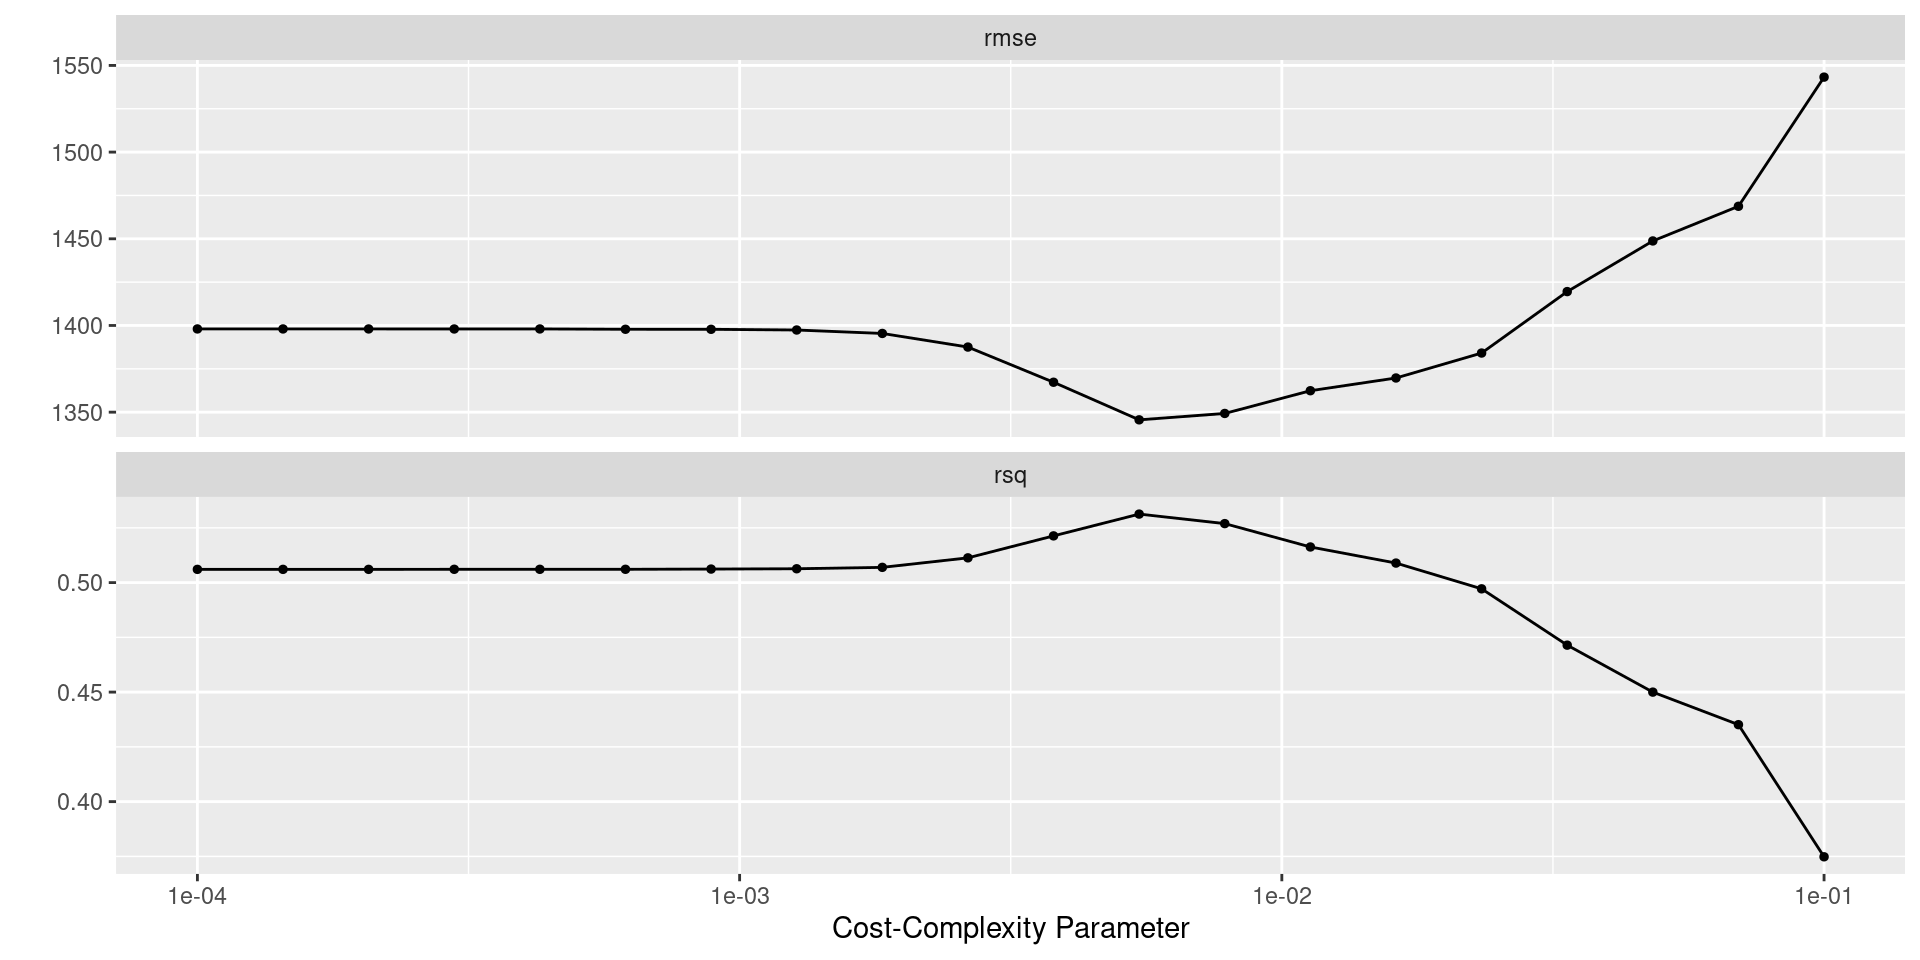
Select Best Trees
Fit Best Tree
Fit OSE Tree

Questions
- Why are both models the same but have different RMSE estimates from CV?
- What’s the difference between encoding
mnthas an ordinal variable vs. a one-hot encoding?
Decision Trees
- Advantages
- Easy to explain and interpret
- Closely mirror human decision-making
- Can be displayed graphically, and are easily interpreted by non-experts
- Does not require standardization of predictors
- Can handle missing data directly
- Can easily capture non-linear patterns
- Disadvantages
- Do not have same level of prediction accuracy
- Not very robust
Classification Trees
- Predictions:
- Classes: most common class at terminal node
- Probability: proportion of each class at terminal node
- Rest of tree: same as regression tree
Exploring Decision Trees w/ App
- Dr. F will split you into four groups
- On one of your computers connect to a tv and open this app
- Do the following based on your group number:
- 1: Choose plane on the first screen
- 2: Choose circle on the first screen
- 3: Choose parabola on the first screen
- 4: Choose sine curve on the first screen
- We will generate data from this population… do you think KNN, logistic regression, or a decision tree will yield a better classifier? Why?
Exploring Decision Trees w/ App
- Choose one of the populations
- Generate some data
- Fit a decision tree to the data and see how the different hyper parameters impact the resulting model:
- complexity parameter (cp): the larger the number the more pruning
- Minimum leaf size: the minimum number of observations from the training data that must be contained in a leaf
- Max depth: the maximum number of splits before a terminal node
- Write down any interesting observations
Data: Voter Frequency
voter_data <- read_csv('https://raw.githubusercontent.com/fivethirtyeight/data/master/non-voters/nonvoters_data.csv')

glimpse(voter_data)
Rows: 5,836
Columns: 119
$ RespId <dbl> 470001, 470002, 470003, 470007, 480008, 480009, 480010,…
$ weight <dbl> 0.7516, 1.0267, 1.0844, 0.6817, 0.9910, 1.0591, 1.1512,…
$ Q1 <dbl> 1, 1, 1, 1, 1, 1, 1, 1, 1, 1, 1, 1, 1, 1, 1, 1, 1, 1, 1…
$ Q2_1 <dbl> 1, 1, 1, 1, 1, 3, 1, 1, 1, 1, 1, 1, 3, 1, 1, 1, 1, 1, 1…
$ Q2_2 <dbl> 1, 2, 1, 1, 1, 2, 1, 1, 1, 1, 2, 1, 4, 1, 1, 1, 1, 1, 1…
$ Q2_3 <dbl> 2, 2, 2, 1, -1, 3, 2, 2, 1, 2, 2, 1, 2, 3, 1, 1, 1, 1, …
$ Q2_4 <dbl> 4, 3, 2, 3, 1, 4, 3, 2, 3, 1, 2, 4, 2, 3, 1, 1, 1, 1, 2…
$ Q2_5 <dbl> 1, 1, 1, 1, 1, 1, 1, 1, 1, 1, 2, 1, 4, 1, 1, 1, 1, 1, 1…
$ Q2_6 <dbl> 4, 1, 1, 1, 1, 3, 1, 3, 1, 1, 2, 4, 2, 1, 1, 1, 1, 1, 2…
$ Q2_7 <dbl> 2, 2, 2, 1, 1, 3, 1, 1, 1, 1, 2, 2, 1, 1, 1, 1, 1, 1, 1…
$ Q2_8 <dbl> 2, 1, 1, 1, 1, 1, 1, 1, 1, 2, 2, 3, 2, 1, 1, 1, 1, 2, 1…
$ Q2_9 <dbl> 4, 1, 4, 1, 1, 1, 1, 4, 3, 1, 3, 4, 4, 4, 1, 1, 2, 1, 3…
$ Q2_10 <dbl> 2, 3, 3, 2, 1, 4, 3, 2, 2, 2, 3, 2, 2, 3, 4, 2, 1, 1, 1…
$ Q3_1 <dbl> 1, 3, 2, 1, 4, 1, 2, 2, 1, 3, 3, 1, 4, 1, 3, 3, 4, 4, 3…
$ Q3_2 <dbl> 1, 3, 2, 1, -1, 2, 3, 3, 4, 3, 3, 1, 4, 1, 4, 4, 2, 4, …
$ Q3_3 <dbl> 4, 4, 3, 4, 1, -1, 3, 3, 2, 3, 2, 4, 1, 4, 4, 4, 4, 1, …
$ Q3_4 <dbl> 4, 3, 3, 4, 1, 2, 2, 1, 1, 2, 2, 4, 1, 1, 1, 1, 4, 1, 2…
$ Q3_5 <dbl> 3, 3, 2, 2, 2, 2, 2, 1, 2, 3, 2, 3, 1, 1, 2, 2, 3, 3, 2…
$ Q3_6 <dbl> 2, 2, 2, 1, 4, 2, 2, 2, 1, 2, 3, 1, 4, 1, 1, 2, 4, 3, 2…
$ Q4_1 <dbl> 2, 2, 2, 1, 1, 4, 2, 1, 2, 2, 2, 2, 1, 2, 2, 1, 1, 1, 2…
$ Q4_2 <dbl> 1, 2, 2, 2, 1, 3, 1, 1, 2, 3, 2, 1, 1, 2, 2, 1, 1, 1, 1…
$ Q4_3 <dbl> 2, 2, 3, 2, 1, 3, 1, 2, 2, 3, 3, 1, 1, 2, 2, 1, 1, 1, 1…
$ Q4_4 <dbl> 2, 3, 3, 2, 1, 3, 2, 2, 4, 3, 3, 2, 3, 4, 4, 2, 1, 1, 2…
$ Q4_5 <dbl> 2, 3, 2, 2, 1, 4, 1, 2, 3, 2, 3, 1, 2, 2, 2, 1, 1, 2, 3…
$ Q4_6 <dbl> 2, 1, 3, 2, 1, 2, 1, 3, 3, 3, 3, 2, 4, 2, 1, 2, 1, 1, 3…
$ Q5 <dbl> 1, 1, 1, 1, 1, 2, 1, 1, 1, 1, 1, 1, 1, 2, 1, 1, 1, 1, 1…
$ Q6 <dbl> 2, 2, 1, 3, 2, 4, 1, 1, 3, 3, 3, 2, 4, 4, 3, 1, 2, 3, 2…
$ Q7 <dbl> 1, 2, 1, 1, 2, 1, 1, 1, 1, 1, 1, 1, 1, 1, 1, 1, 1, 2, 1…
$ Q8_1 <dbl> 3, 2, 3, 3, 1, 3, 2, 4, 3, 2, 2, 4, 1, 4, 1, 1, 4, 1, 3…
$ Q8_2 <dbl> 4, 3, 2, 2, 3, 3, -1, 4, 4, 3, 2, 3, 4, 4, 3, 4, 2, 3, …
$ Q8_3 <dbl> 2, 2, 1, 2, 2, 3, 2, 1, 3, 2, 2, 2, 1, 4, 2, 2, 2, 3, 2…
$ Q8_4 <dbl> 1, 2, 1, 2, 3, 2, 1, 1, 2, 2, 2, 3, 3, 2, 2, 2, 1, 2, 1…
$ Q8_5 <dbl> 1, 2, 2, 2, 3, 3, 1, 2, 2, 2, 2, 2, 4, 4, 2, 2, 1, 2, 2…
$ Q8_6 <dbl> 1, 2, 2, 2, 3, 3, 1, 2, 2, 2, 2, 2, 3, 2, 2, 3, 2, 2, 2…
$ Q8_7 <dbl> 1, 3, 2, 2, 4, 2, 2, 4, 4, 2, 3, 1, 4, 4, 4, 4, 1, 4, 4…
$ Q8_8 <dbl> 2, 2, 2, 2, 2, 2, 1, 1, 2, 1, 2, 3, 2, 2, 1, 1, 1, 1, 2…
$ Q8_9 <dbl> 4, 2, 1, 2, 2, 2, 2, 1, 2, 2, 3, 2, 3, 2, 1, 1, 1, 2, 1…
$ Q9_1 <dbl> 2, 1, 1, 1, 1, -1, 1, 1, 1, 2, 1, 2, 2, 3, 1, 1, 1, 1, …
$ Q9_2 <dbl> 2, 1, 2, 2, 4, -1, 2, 2, 4, 2, 2, 2, 3, 3, 4, 4, 4, 4, …
$ Q9_3 <dbl> 4, 3, 4, 4, 3, -1, 2, 3, 4, 3, 3, 4, 2, 3, 3, 3, 4, 4, …
$ Q9_4 <dbl> 4, 4, 4, 4, 4, 4, 3, 4, 4, 3, 4, 4, 4, 3, 4, 4, 4, 4, 4…
$ Q10_1 <dbl> 2, 2, 2, 2, 2, 2, 2, 2, 2, 2, 2, 2, 2, 2, 2, 2, 2, 2, 2…
$ Q10_2 <dbl> 2, 2, 2, 2, 2, 2, 1, 2, 1, 1, 2, 2, 2, 2, 2, 2, 2, 2, 2…
$ Q10_3 <dbl> 2, 2, 1, 2, 2, 2, 2, 2, 1, 2, 2, 2, 2, 2, 2, 1, 2, 2, 2…
$ Q10_4 <dbl> 2, 2, 2, 2, 2, 2, 2, 2, 2, 2, 2, 2, 2, 2, 2, 2, 2, 2, 2…
$ Q11_1 <dbl> 2, 2, 2, 1, 2, 2, 2, 2, 2, 2, 2, 1, 2, 2, 2, 2, 2, 2, 2…
$ Q11_2 <dbl> 2, 2, 2, 2, 2, 2, 2, 2, 2, 2, 2, 2, 2, 2, 2, 2, 2, 2, 2…
$ Q11_3 <dbl> 2, 1, 1, 2, 1, 2, 2, 2, 2, 1, 1, 2, 2, 2, 2, 2, 1, 2, 2…
$ Q11_4 <dbl> 2, 2, 2, 2, 2, 1, 2, 2, 2, 2, 2, 2, 2, 2, 2, 2, 1, 2, 2…
$ Q11_5 <dbl> 2, 2, 1, 1, 2, 2, 2, 2, 2, 2, 2, 2, 1, 2, 1, 2, 2, 2, 2…
$ Q11_6 <dbl> 2, 2, 2, 2, 2, 2, 2, 2, 2, 2, 2, 2, 2, 2, 2, 2, 2, 2, 2…
$ Q14 <dbl> 5, 1, 5, 5, 1, -1, 1, 5, 2, 1, 1, 5, 1, 2, 1, 1, 2, 1, …
$ Q15 <dbl> 1, 1, 2, 1, 5, -1, 3, 1, 4, 5, 1, 2, 5, 2, 3, 5, 1, 4, …
$ Q16 <dbl> 1, 2, 1, 4, 1, -1, 3, 1, 1, 3, 1, 2, 1, 1, 1, 1, 1, 1, …
$ Q17_1 <dbl> 1, 2, 1, 1, 2, -1, 3, 1, 2, 2, 2, 2, 2, 3, 1, 1, 1, 1, …
$ Q17_2 <dbl> 1, 2, 3, 1, 2, -1, 2, 1, 1, 1, 2, 1, 4, 3, 1, 1, 1, 1, …
$ Q17_3 <dbl> 1, 2, 1, 1, 4, -1, 4, 1, 2, 1, 3, 1, 4, 3, 2, 3, 1, 4, …
$ Q17_4 <dbl> 3, 3, 1, 1, 4, -1, 2, 2, 4, 2, 2, 3, 2, 2, 4, 4, 1, 4, …
$ Q18_1 <dbl> 2, 2, 2, 2, 2, 2, 2, 2, 2, 2, 2, 1, 2, 2, 2, 2, 2, 2, 2…
$ Q18_2 <dbl> 2, 2, 2, 2, 2, 2, 2, 2, 2, 2, 2, 2, 2, 2, 2, 2, 2, 2, 2…
$ Q18_3 <dbl> 2, 2, 2, 2, 2, 2, 2, 2, 2, 2, 2, 2, 2, 2, 2, 2, 2, 2, 2…
$ Q18_4 <dbl> 2, 2, 2, 2, 2, 2, 2, 2, 2, 2, 2, 2, 2, 2, 2, 2, 2, 2, 2…
$ Q18_5 <dbl> 2, 2, 2, 2, 2, 2, 2, 2, 2, 2, 2, 2, 2, 2, 2, 2, 2, 2, 2…
$ Q18_6 <dbl> 2, 2, 2, 2, 2, 2, 2, 2, 2, 2, 2, 2, 2, 2, 2, 2, 2, 2, 2…
$ Q18_7 <dbl> 2, 2, 1, 2, 2, 2, 2, 2, 2, 2, 2, 2, 2, 2, 2, 2, 2, 2, 2…
$ Q18_8 <dbl> 2, 2, 2, 2, 2, 2, 2, 2, 2, 2, 2, 1, 2, 2, 2, 2, 2, 1, 2…
$ Q18_9 <dbl> 2, 2, 2, 2, 2, 2, 2, 2, 2, 2, 2, 1, 2, 2, 2, 2, 2, 2, 2…
$ Q18_10 <dbl> 2, 2, 2, 2, 2, 2, 2, 2, 2, 2, 2, 2, 2, 2, 2, 2, 2, 2, 2…
$ Q19_1 <dbl> -1, -1, -1, -1, -1, -1, 1, -1, 1, 1, 1, -1, -1, -1, 1, …
$ Q19_2 <dbl> -1, 1, 1, -1, -1, -1, -1, 1, 1, -1, 1, -1, -1, -1, 1, 1…
$ Q19_3 <dbl> 1, -1, -1, 1, -1, -1, -1, -1, 1, -1, 1, 1, 1, -1, 1, -1…
$ Q19_4 <dbl> 1, -1, 1, -1, -1, -1, -1, 1, 1, -1, 1, 1, -1, -1, -1, -…
$ Q19_5 <dbl> 1, -1, -1, -1, -1, -1, -1, 1, 1, 1, 1, 1, -1, -1, -1, -…
$ Q19_6 <dbl> 1, -1, -1, -1, -1, -1, -1, -1, 1, 1, 1, 1, -1, -1, 1, -…
$ Q19_7 <dbl> 1, -1, -1, -1, -1, -1, -1, 1, 1, -1, 1, 1, 1, -1, -1, -…
$ Q19_8 <dbl> -1, -1, 1, 1, -1, -1, -1, -1, 1, -1, 1, -1, 1, -1, -1, …
$ Q19_9 <dbl> -1, -1, 1, -1, -1, -1, -1, 1, 1, -1, 1, -1, 1, -1, -1, …
$ Q19_10 <dbl> -1, -1, -1, 1, -1, -1, -1, -1, -1, -1, -1, -1, -1, 1, -…
$ Q20 <dbl> 1, 1, 1, 1, 1, 2, 1, 1, 1, 1, 1, 1, 2, 1, 1, 1, 1, 1, 1…
$ Q21 <dbl> 1, 1, 1, 1, 1, 2, 1, 1, 1, 2, 1, 1, 2, 1, 3, 1, 1, 1, 1…
$ Q22 <dbl> NA, NA, NA, NA, NA, 7, NA, NA, NA, NA, NA, NA, 6, NA, N…
$ Q23 <dbl> 2, 1, 2, 2, 1, -1, 1, 2, 1, 1, 1, 2, 1, 3, 1, 1, 2, 1, …
$ Q24 <dbl> 1, 3, 1, 1, 3, 4, 1, 1, 3, 1, 3, 3, 3, 1, 3, 3, 1, 3, 1…
$ Q25 <dbl> 1, 3, 2, 2, 1, 3, 1, 2, 1, 2, 3, 1, 2, 4, 1, 1, 1, 1, 1…
$ Q26 <dbl> 1, 1, 1, 1, 1, 4, 1, 1, 1, 1, 1, 1, 4, 1, 1, 1, 1, 1, 1…
$ Q27_1 <dbl> 1, 1, 1, 1, 1, 2, 1, 1, 1, 1, 2, 1, 2, 1, 1, 1, 1, 1, 1…
$ Q27_2 <dbl> 1, 1, 1, 1, 1, 2, 1, 1, 1, 1, 1, 1, 2, 1, 1, 1, 1, 1, 1…
$ Q27_3 <dbl> 1, 1, 1, 1, 1, 2, 1, 1, 1, 1, 2, 1, 2, 1, 1, 1, 1, 1, 1…
$ Q27_4 <dbl> 1, 1, 1, 1, 1, 2, 1, 1, 1, 1, 1, 1, 2, 1, 1, 1, 1, 1, 1…
$ Q27_5 <dbl> 1, 1, 1, 1, 1, 2, 1, 1, 1, 1, 2, 1, 2, 1, 1, 1, 1, 1, 1…
$ Q27_6 <dbl> 1, 1, 1, 1, 1, 2, 1, 1, 1, 1, 1, 1, 2, 1, 1, 1, 1, 1, 1…
$ Q28_1 <dbl> 1, 1, 1, 1, 1, NA, 1, 1, 1, 1, 1, 1, NA, -1, 1, -1, 1, …
$ Q28_2 <dbl> 1, -1, -1, 1, 1, NA, -1, -1, -1, 1, -1, 1, NA, -1, 1, -…
$ Q28_3 <dbl> 1, -1, -1, -1, 1, NA, 1, -1, 1, -1, -1, -1, NA, -1, 1, …
$ Q28_4 <dbl> 1, -1, -1, 1, -1, NA, 1, -1, -1, -1, 1, 1, NA, -1, 1, -…
$ Q28_5 <dbl> -1, -1, -1, -1, 1, NA, 1, -1, -1, -1, -1, 1, NA, -1, -1…
$ Q28_6 <dbl> -1, 1, -1, -1, -1, NA, -1, 1, -1, -1, -1, 1, NA, -1, 1,…
$ Q28_7 <dbl> 1, -1, 1, -1, 1, NA, -1, -1, 1, 1, -1, -1, NA, -1, 1, -…
$ Q28_8 <dbl> -1, -1, -1, -1, -1, NA, -1, -1, -1, -1, -1, -1, NA, 1, …
$ Q29_1 <dbl> NA, NA, NA, NA, NA, -1, NA, NA, NA, NA, NA, NA, -1, NA,…
$ Q29_2 <dbl> NA, NA, NA, NA, NA, -1, NA, NA, NA, NA, NA, NA, 1, NA, …
$ Q29_3 <dbl> NA, NA, NA, NA, NA, -1, NA, NA, NA, NA, NA, NA, -1, NA,…
$ Q29_4 <dbl> NA, NA, NA, NA, NA, -1, NA, NA, NA, NA, NA, NA, -1, NA,…
$ Q29_5 <dbl> NA, NA, NA, NA, NA, -1, NA, NA, NA, NA, NA, NA, -1, NA,…
$ Q29_6 <dbl> NA, NA, NA, NA, NA, -1, NA, NA, NA, NA, NA, NA, -1, NA,…
$ Q29_7 <dbl> NA, NA, NA, NA, NA, -1, NA, NA, NA, NA, NA, NA, -1, NA,…
$ Q29_8 <dbl> NA, NA, NA, NA, NA, -1, NA, NA, NA, NA, NA, NA, -1, NA,…
$ Q29_9 <dbl> NA, NA, NA, NA, NA, 1, NA, NA, NA, NA, NA, NA, -1, NA, …
$ Q29_10 <dbl> NA, NA, NA, NA, NA, -1, NA, NA, NA, NA, NA, NA, -1, NA,…
$ Q30 <dbl> 2, 3, 2, 2, 1, 5, 1, 2, 1, 3, 1, 2, 1, 5, 1, 1, 2, 1, 5…
$ Q31 <dbl> NA, NA, NA, NA, -1, NA, 1, NA, 1, NA, 1, NA, 2, NA, 1, …
$ Q32 <dbl> 1, NA, 2, 1, NA, NA, NA, 1, NA, NA, NA, 1, NA, NA, NA, …
$ Q33 <dbl> NA, 1, NA, NA, NA, -1, NA, NA, NA, 1, NA, NA, NA, 1, NA…
$ ppage <dbl> 73, 90, 53, 58, 81, 61, 80, 68, 70, 83, 43, 42, 48, 52,…
$ educ <chr> "College", "College", "College", "Some college", "High …
$ race <chr> "White", "White", "White", "Black", "White", "White", "…
$ gender <chr> "Female", "Female", "Male", "Female", "Male", "Female",…
$ income_cat <chr> "$75-125k", "$125k or more", "$125k or more", "$40-75k"…
$ voter_category <chr> "always", "always", "sporadic", "sporadic", "always", "…Cleaning Data: Missing Data
Cleaning the Data: Q28, 29, 31
- What should we do with question 28?
- What should we do with question 29?
- What should we do with question 31?