MATH 427: Boosting
Eric Friedlander
Computational Set-Up
Exploring Bagging Using App
Ensemble Methods
- Single regression or classification trees usually have poor predictive performance.
- Ensemble Methods: use a collection of models (in this case, decision trees) to improve the predictive performance
- Downside: Interpretability
- Last Time:
- Bagging
- Random Forests
- This Time:
- Boosting
Flexibility vs. Interpretability
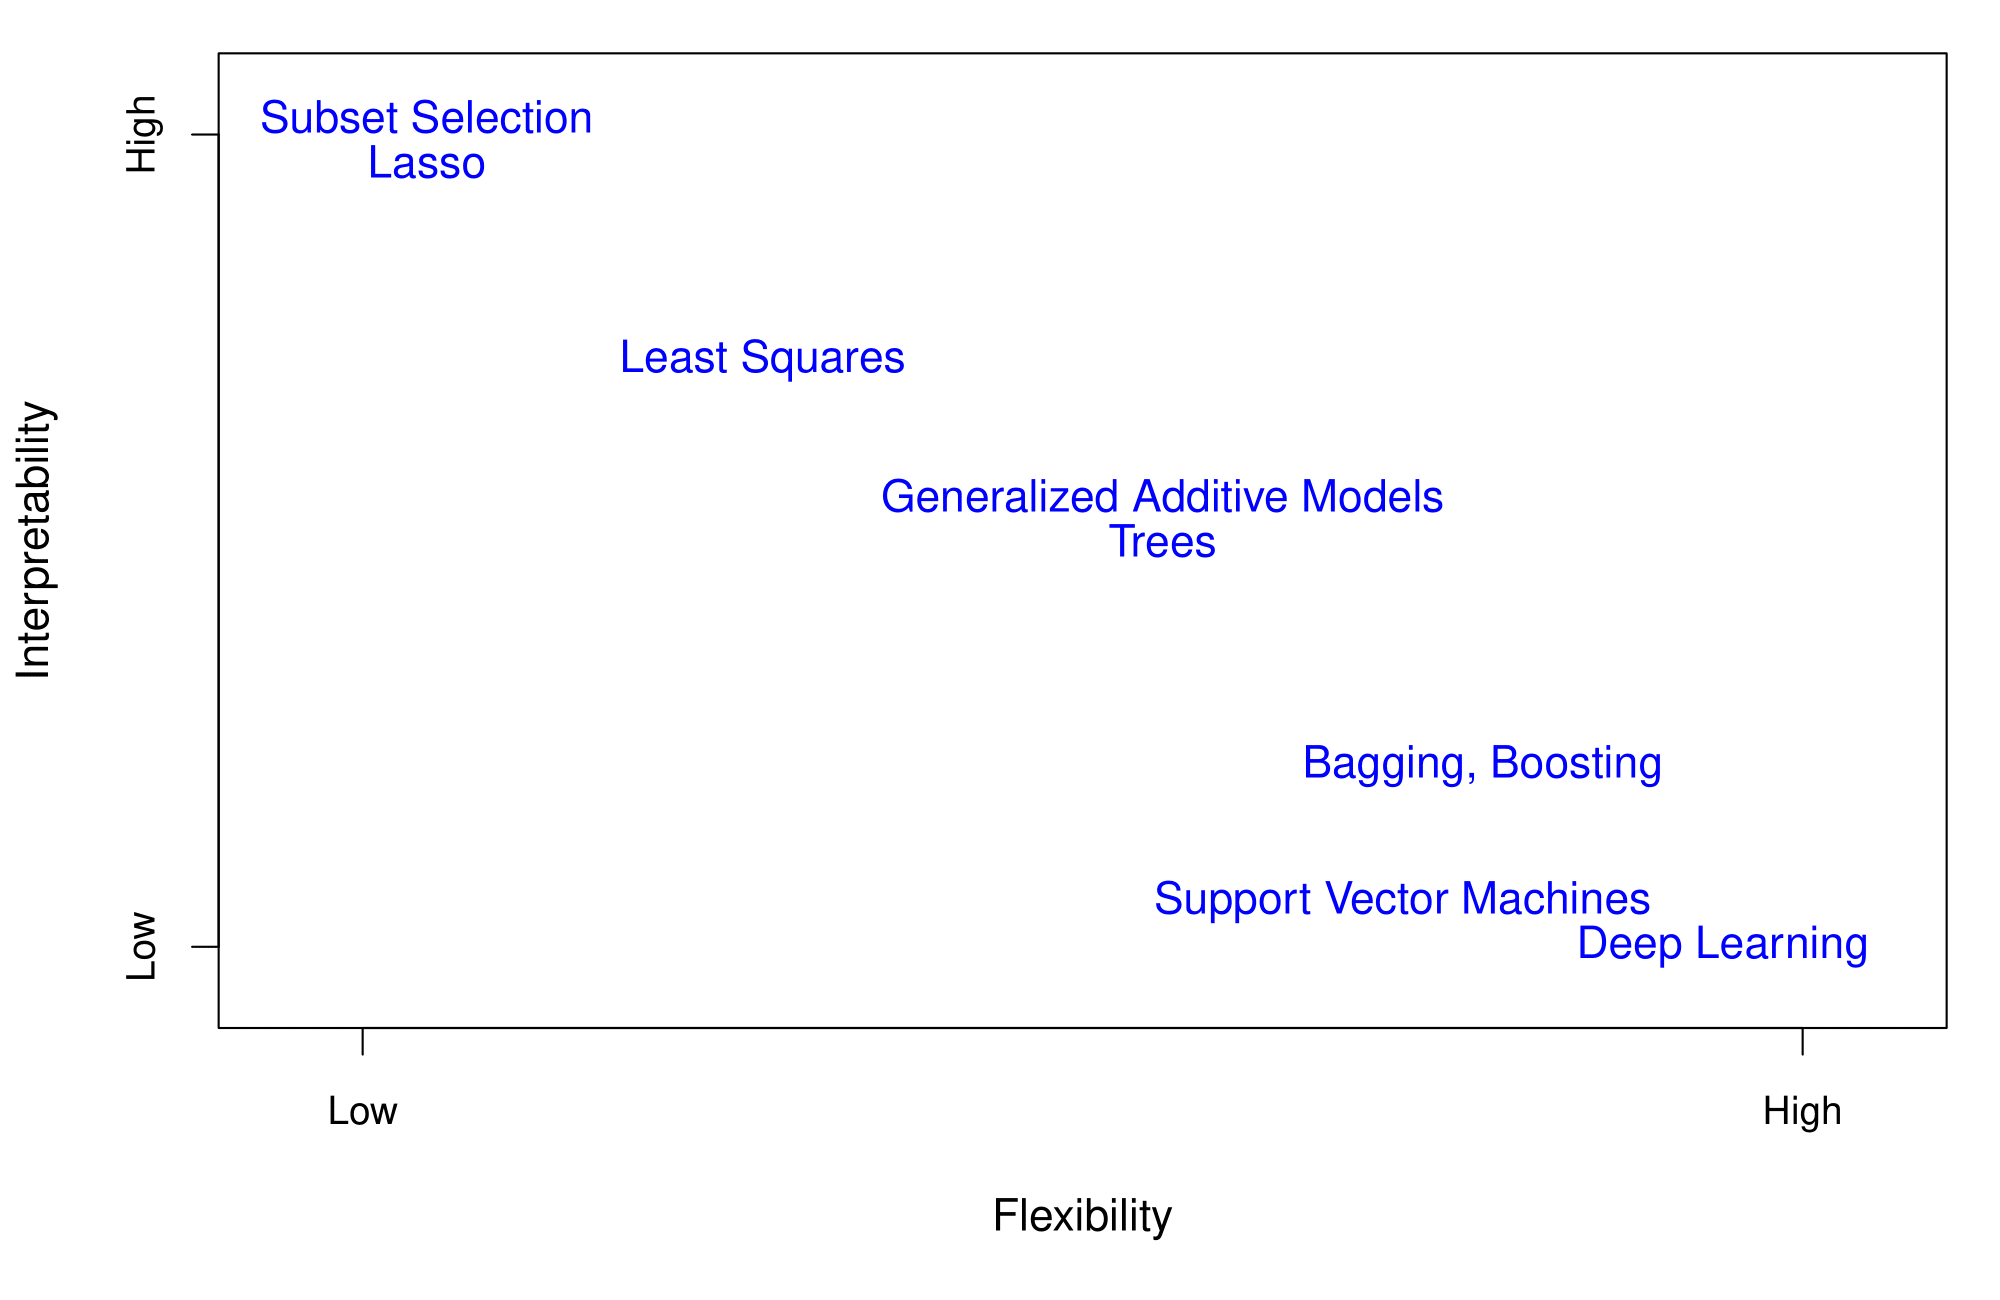
Adapted from ISLR, James et al.
Boosting
Boosting
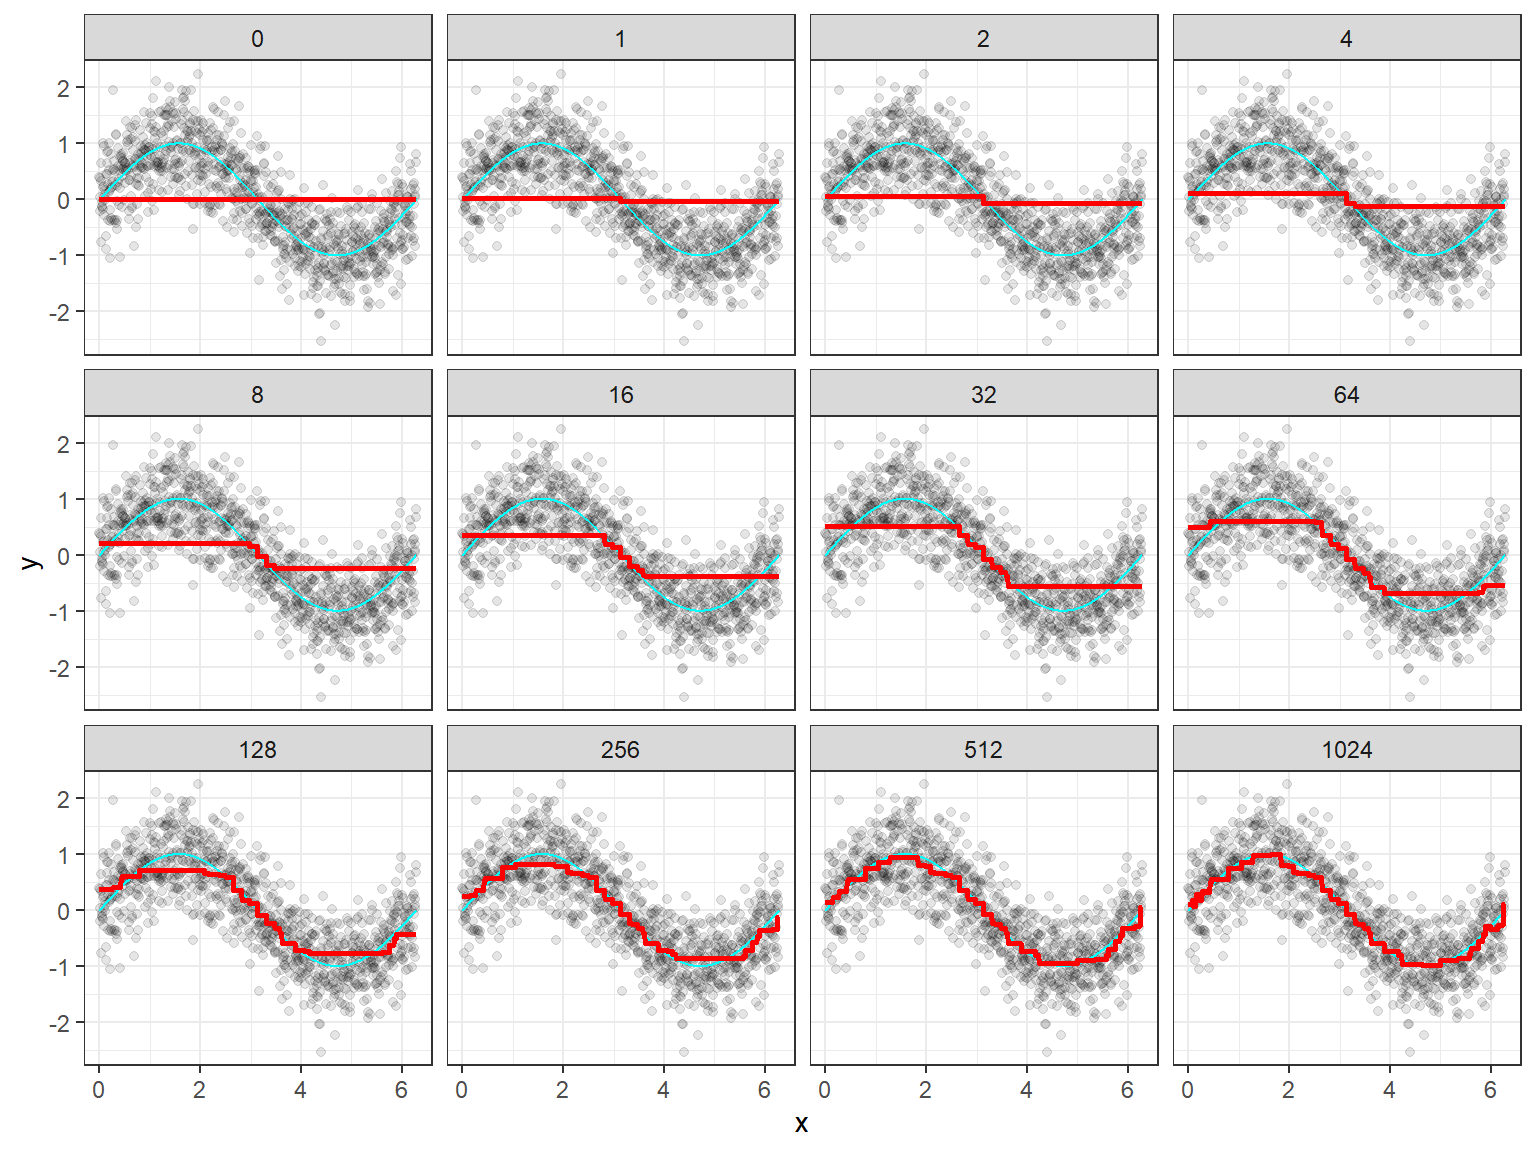
- Still an ensemble method in that it creates a bunch of models (trees in this case)
- Trees are created sequentially, and fit to the residuals of the previous trees
- Idea: each additional tree to improve upon the previous trees by focusing on places where the previous trees perform poorly
- Each model in the process is a weak model, referred to as a base learner
- learning slowly: as more trees are fit, the overall ensemble gradually improves
- Remind me: What is a residual?
Boosting Algorithm
Let \(B\) be the number of trees you want to fit and \(d\) the maximum number of splits
- Set \(\hat{f}(x) = 0\) and \(r_i = y_i\) for all training set
- For \(b = 1,\ldots, B\):
- Fit tree \(\hat{f}_b\) with \(d\) splits (\(d+1\) leaves) using psuedo-residuals \(r\) as response and features \(X\) as predictors.
- Update full model \(\hat{f}\): \(\hat{f} = \hat{f} + \lambda\hat{f}_b\)
- Update pseudo-residuals: \(r_i = r_i - \lambda\hat{f}_b(x_i)\)
- Output final model: \[\hat{f}(x) = \displaystyle \sum_{b=1}^{B} \lambda \ \hat{f}_b(x)\]
- It may be hard to see, but this is similar to gradient descent and so is called gradient boosting
Gradient Boosting
Many Implementations of Boosting
- Any implementation of boosting you use will like be a tweak of this
- AdaBoost
- Catboost
- LightGBM
- XGBoost
Gradient Boosting Tuning Parameters
Gradient Boosting in R
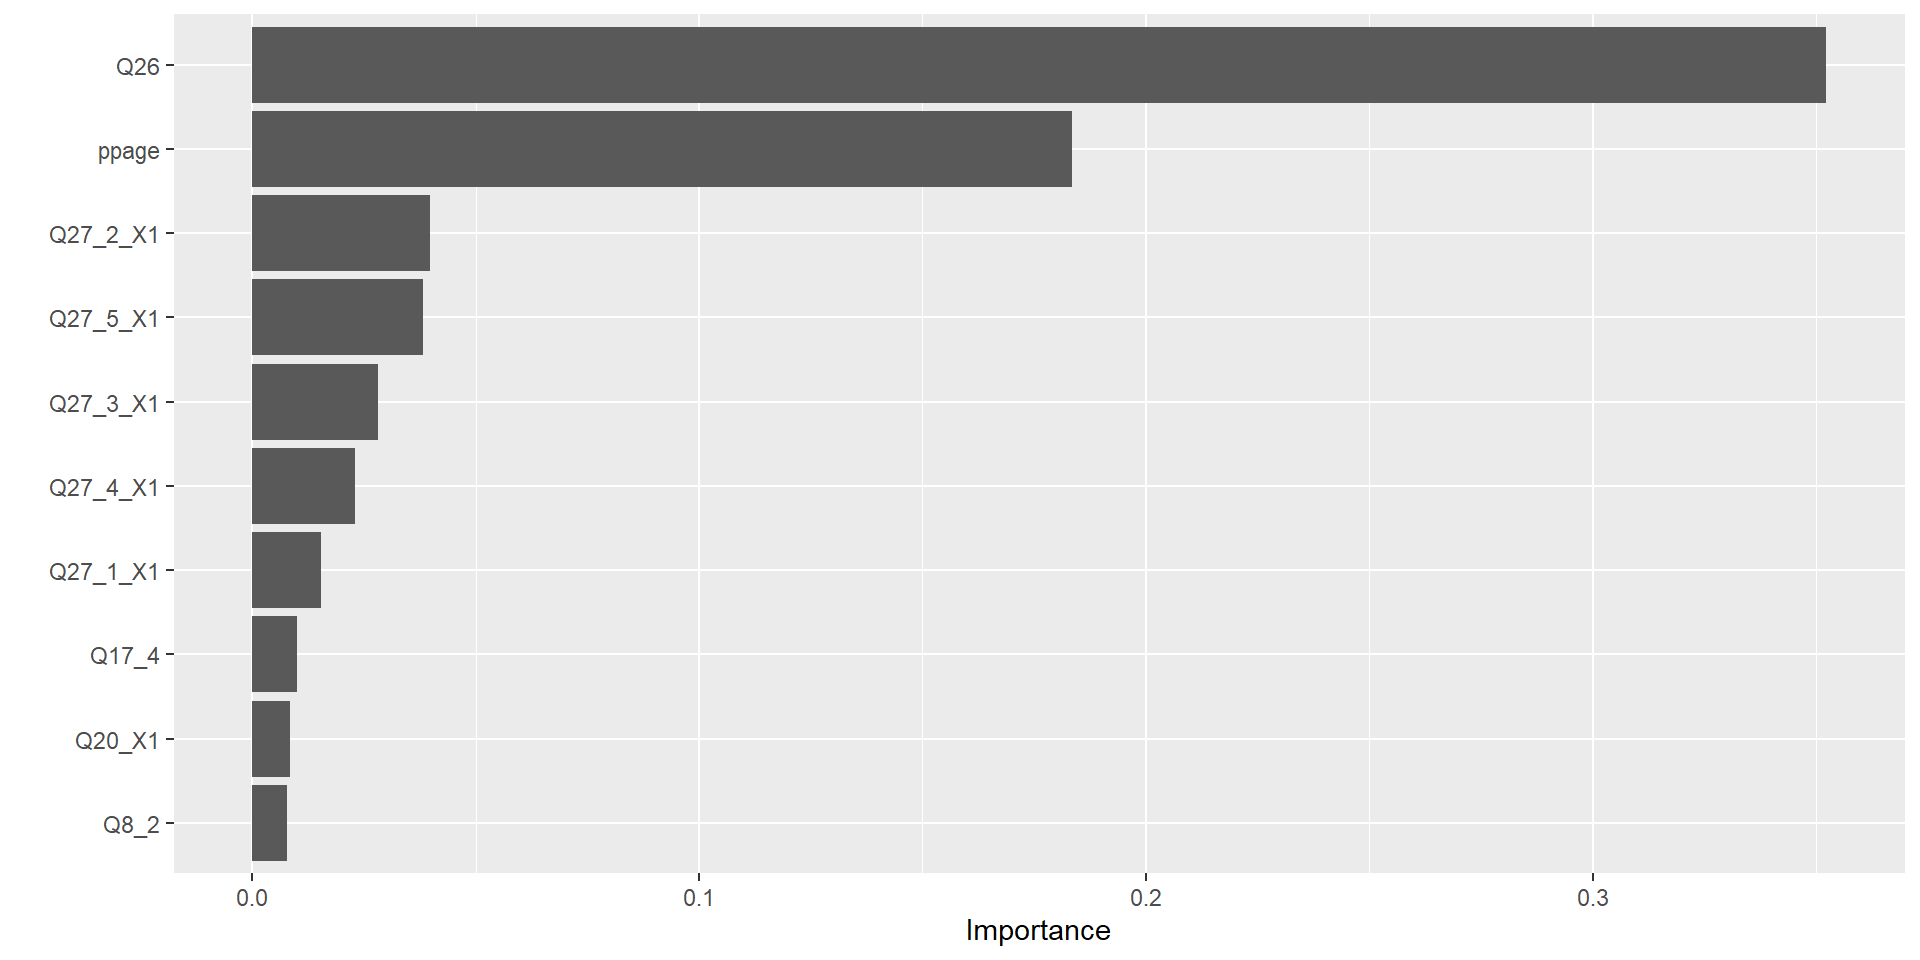
Data: Voter Frequency
- Info about data
- Goal: Identify individuals who are unlikely to vote to help organization target “get out the vote” effort.
voter_data <- read_csv('https://raw.githubusercontent.com/fivethirtyeight/data/master/non-voters/nonvoters_data.csv')

voter_clean <- voter_data |>
  select(-RespId, -weight, -Q1) |>
  mutate(
    educ = factor(educ, levels = c("High school or less", "Some college", "College")),
    income_cat = factor(income_cat, levels = c("Less than $40k", "$40-75k ",
                                               "$75-125k", "$125k or more")),
    voter_category = factor(voter_category, levels = c("rarely/never", "sporadic", "always"))
  ) |>
  filter(Q22 != 5 | is.na(Q22)) |>
  mutate(Q22 = as_factor(Q22),
         Q22 = if_else(is.na(Q22), "Not Asked", Q22),
         across(Q28_1:Q28_8, ~if_else(.x == -1, 0, .x)),
         across(Q28_1:Q28_8, ~ as_factor(.x)),
         across(Q28_1:Q28_8, ~if_else(is.na(.x) , "Not Asked", .x)),
         across(Q29_1:Q29_10, ~if_else(.x == -1, 0, .x)),
         across(Q29_1:Q29_10, ~ as_factor(.x)),
         across(Q29_1:Q29_8, ~if_else(is.na(.x) , "Not Asked", .x)),
        Party_ID = as_factor(case_when(
          Q31 == 1 ~ "Strong Republican",
          Q31 == 2 ~ "Republican",
          Q32 == 1  ~ "Strong Democrat",
          Q32 == 2 ~ "Democrat",
          Q33 == 1 ~ "Lean Republican",
          Q33 == 2 ~ "Lean Democrat",
          TRUE ~ "Other"
        )),
        Party_ID = factor(Party_ID, levels =c("Strong Republican", "Republican", "Lean Republican",
                                                "Other", "Lean Democrat", "Democrat", "Strong Democrat")),
        across(!ppage, ~as_factor(if_else(.x == -1, NA, .x))))
Split Data
Define Model
trees: VERY MUCH A TUNING PARAMETER NOW!
Define Recipe
gbm_recipe <- recipe(voter_category ~ . , data = voter_train) |>
  step_indicate_na(all_predictors()) |>
  step_zv(all_predictors()) |>
  step_integer(educ, income_cat, Party_ID, Q2_2:Q4_6, Q6, Q8_1:Q9_4, Q14:Q17_4,
               Q25:Q26) |>
  step_impute_median(all_numeric_predictors()) |>
  step_impute_mode(all_nominal_predictors()) |>
  step_dummy(all_nominal_predictors(), one_hot = TRUE)
Define Workflow and Fit
Creating Hyperparameter Grid
Tuning Hyperparameters in Parallel
- Check out Chapter 10.4 of TMWR
- Implementation depends on operating system
Results
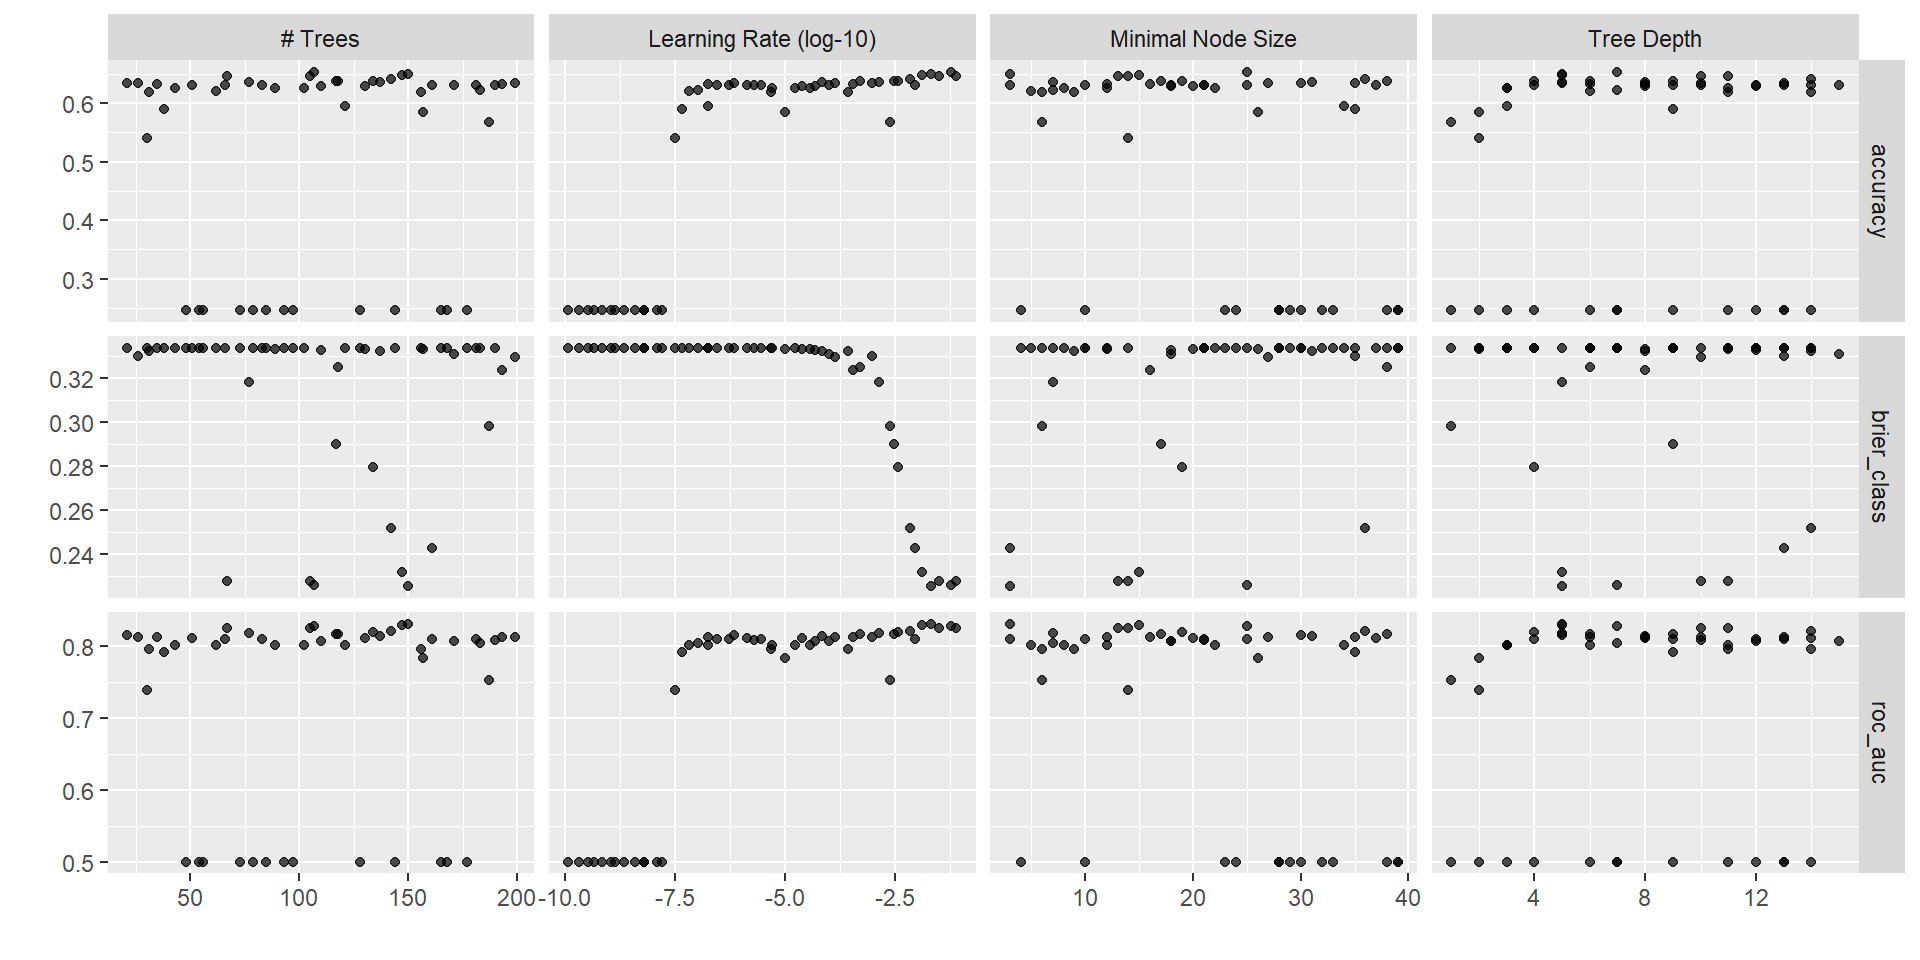
Which one was best?
Evaluate performance
gbm_fit <-  gbm_wf |>
  finalize_workflow(select_best(tuning_results, metric = "accuracy")) |>
  fit(voter_train)

augment(gbm_fit, new_data = voter_test) |>
  accuracy(truth = voter_category, estimate = .pred_class)
# A tibble: 1 × 3
.metric .estimator .estimate
<chr> <chr> <dbl>
1 accuracy multiclass 0.653